With a software-defined receiver and a lot of time, we can analyze the utilization of the radio spectrum.
For this experiment, we will use the rtl_power tool, part of the rtl-sdr driver, to monitor power levels across the radio spectrum over a 24-hour period. The data is then compiled into an image with heatmap.py.
The recordings on this page were done in Tacoma, Washington, on a Comet GP-9 at about 20 ft above ground. The dates and times of each recording at printed in the bottom left corner of the image.
The images below are cropped and re-sampled. Click to get the full resolution.
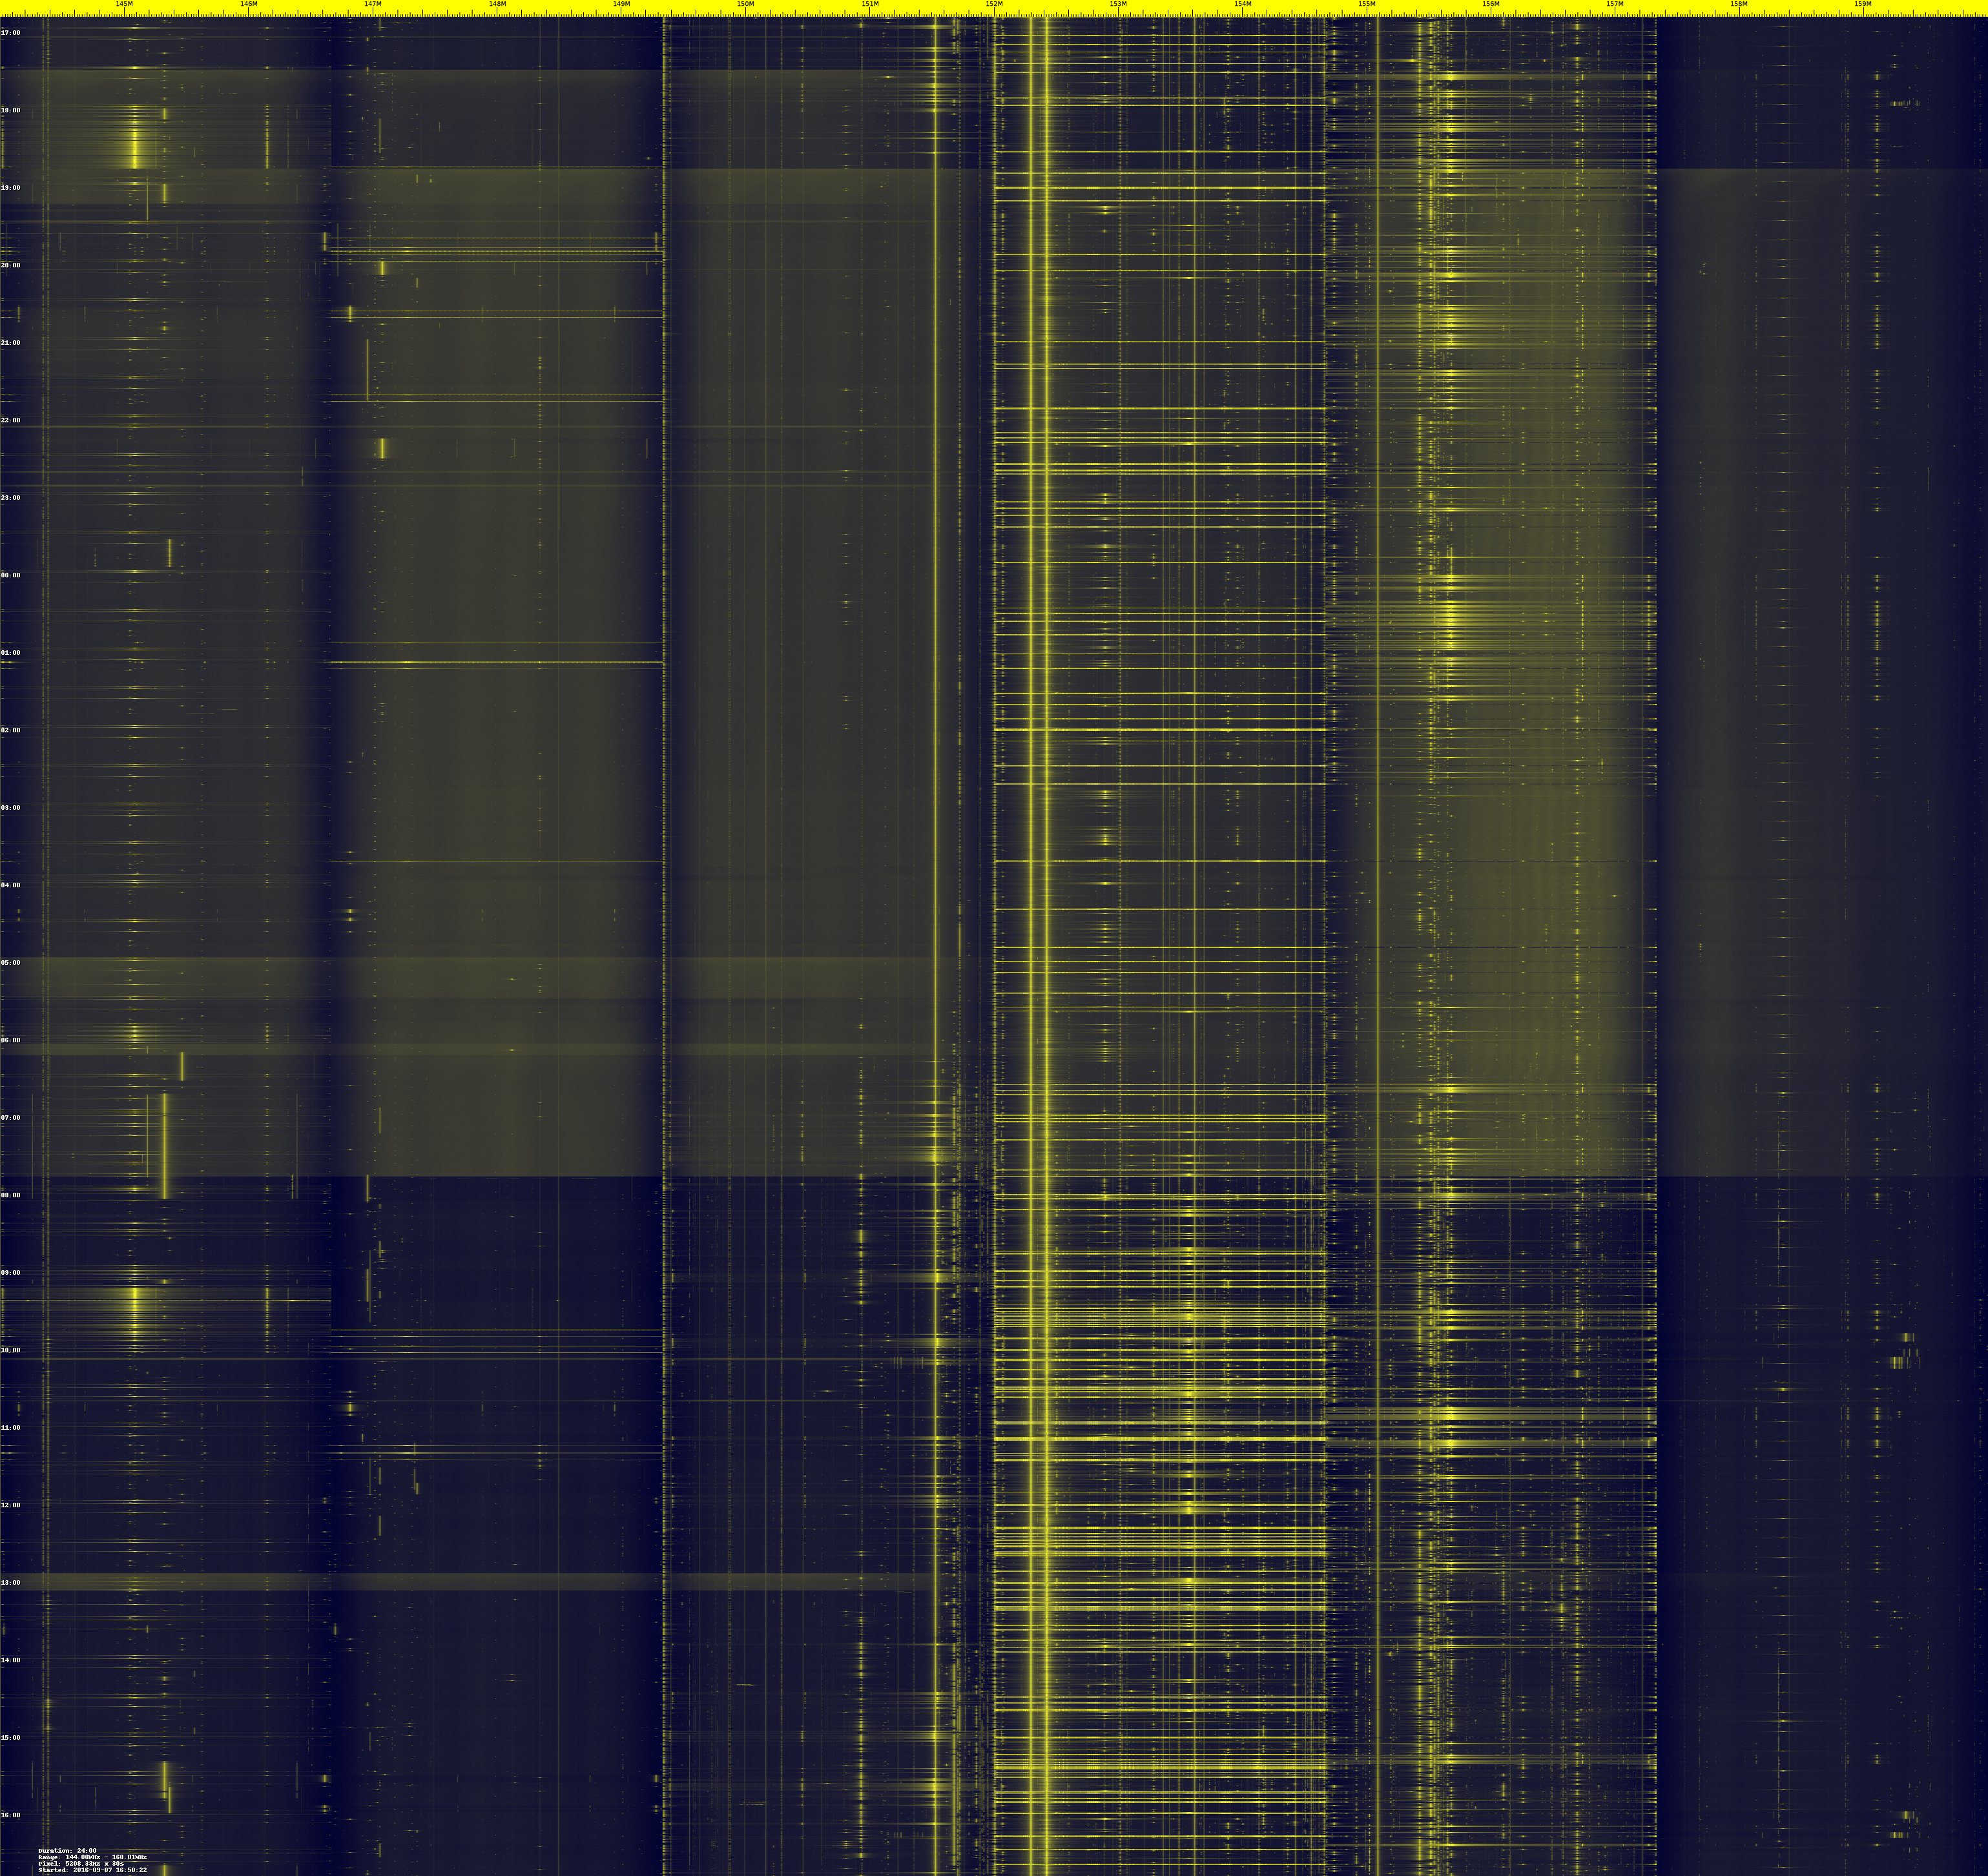
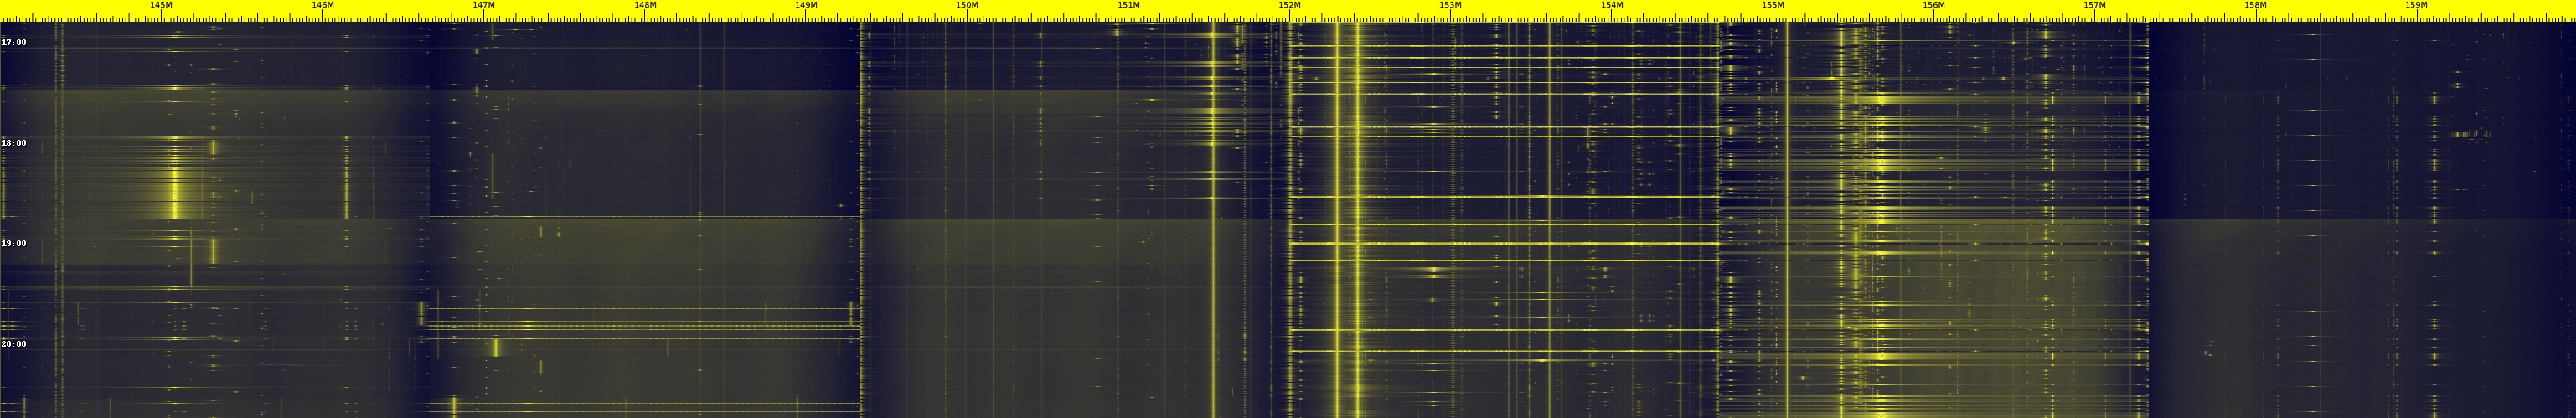
The US 2m band spans 144 to 148 MHz. For perspective, the 148-160 MHz industrial, public safety, and marine bands were also included in this recording.
The following command was used to record data:
rtl_power -f 144M:160M:10k -i 30 -e 24h -g 30 144.csvAnd compiled into a heatmap:
./heatmap.py 144.csv 144.pngThe following command was used to record data:
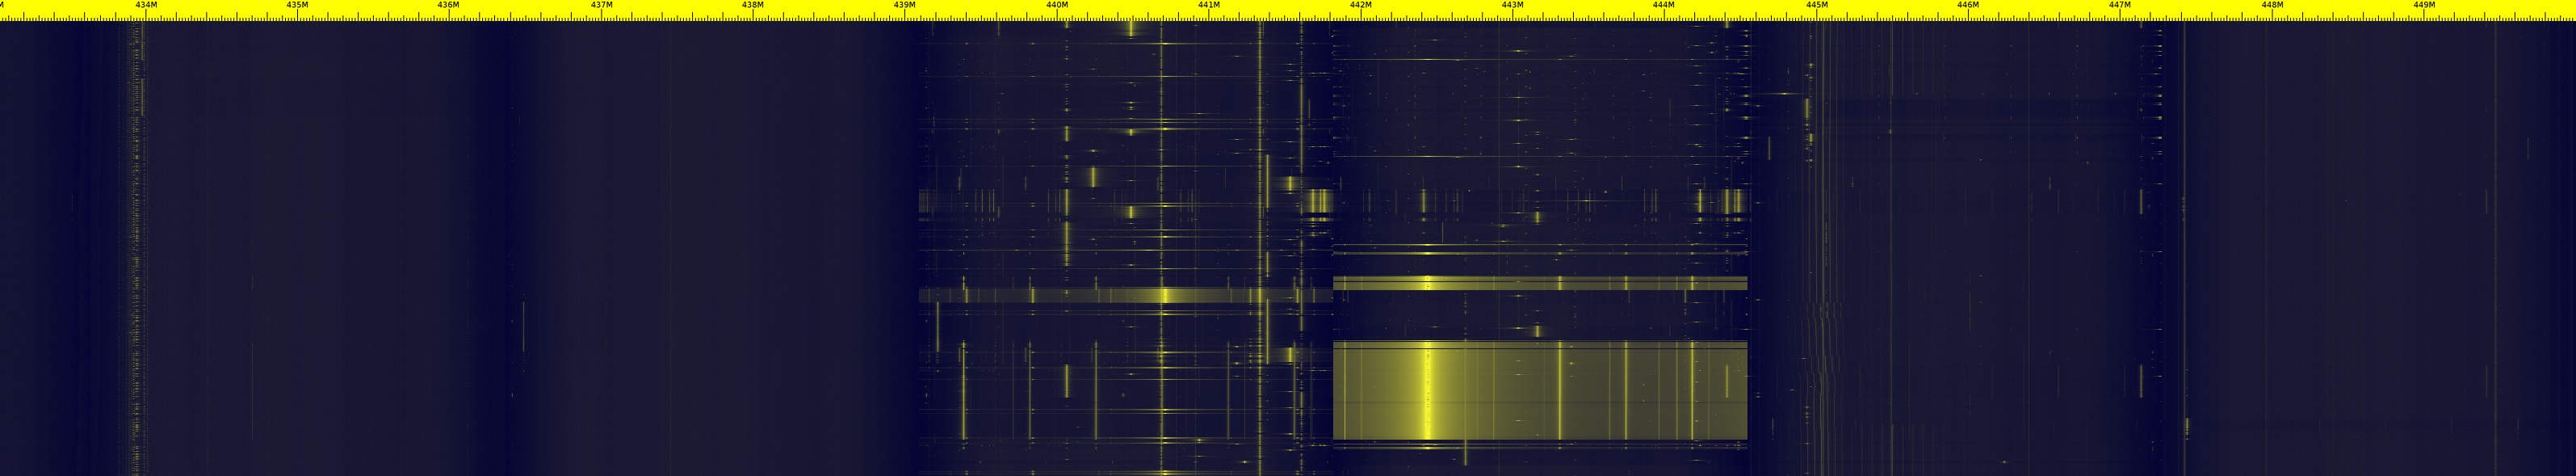
rtl_power -f 420M:450M:10k -i 30 -e 24h -g 30 70cm.csvAnd compiled into a heatmap:
./heatmap.py 70cm.csv 70cm.png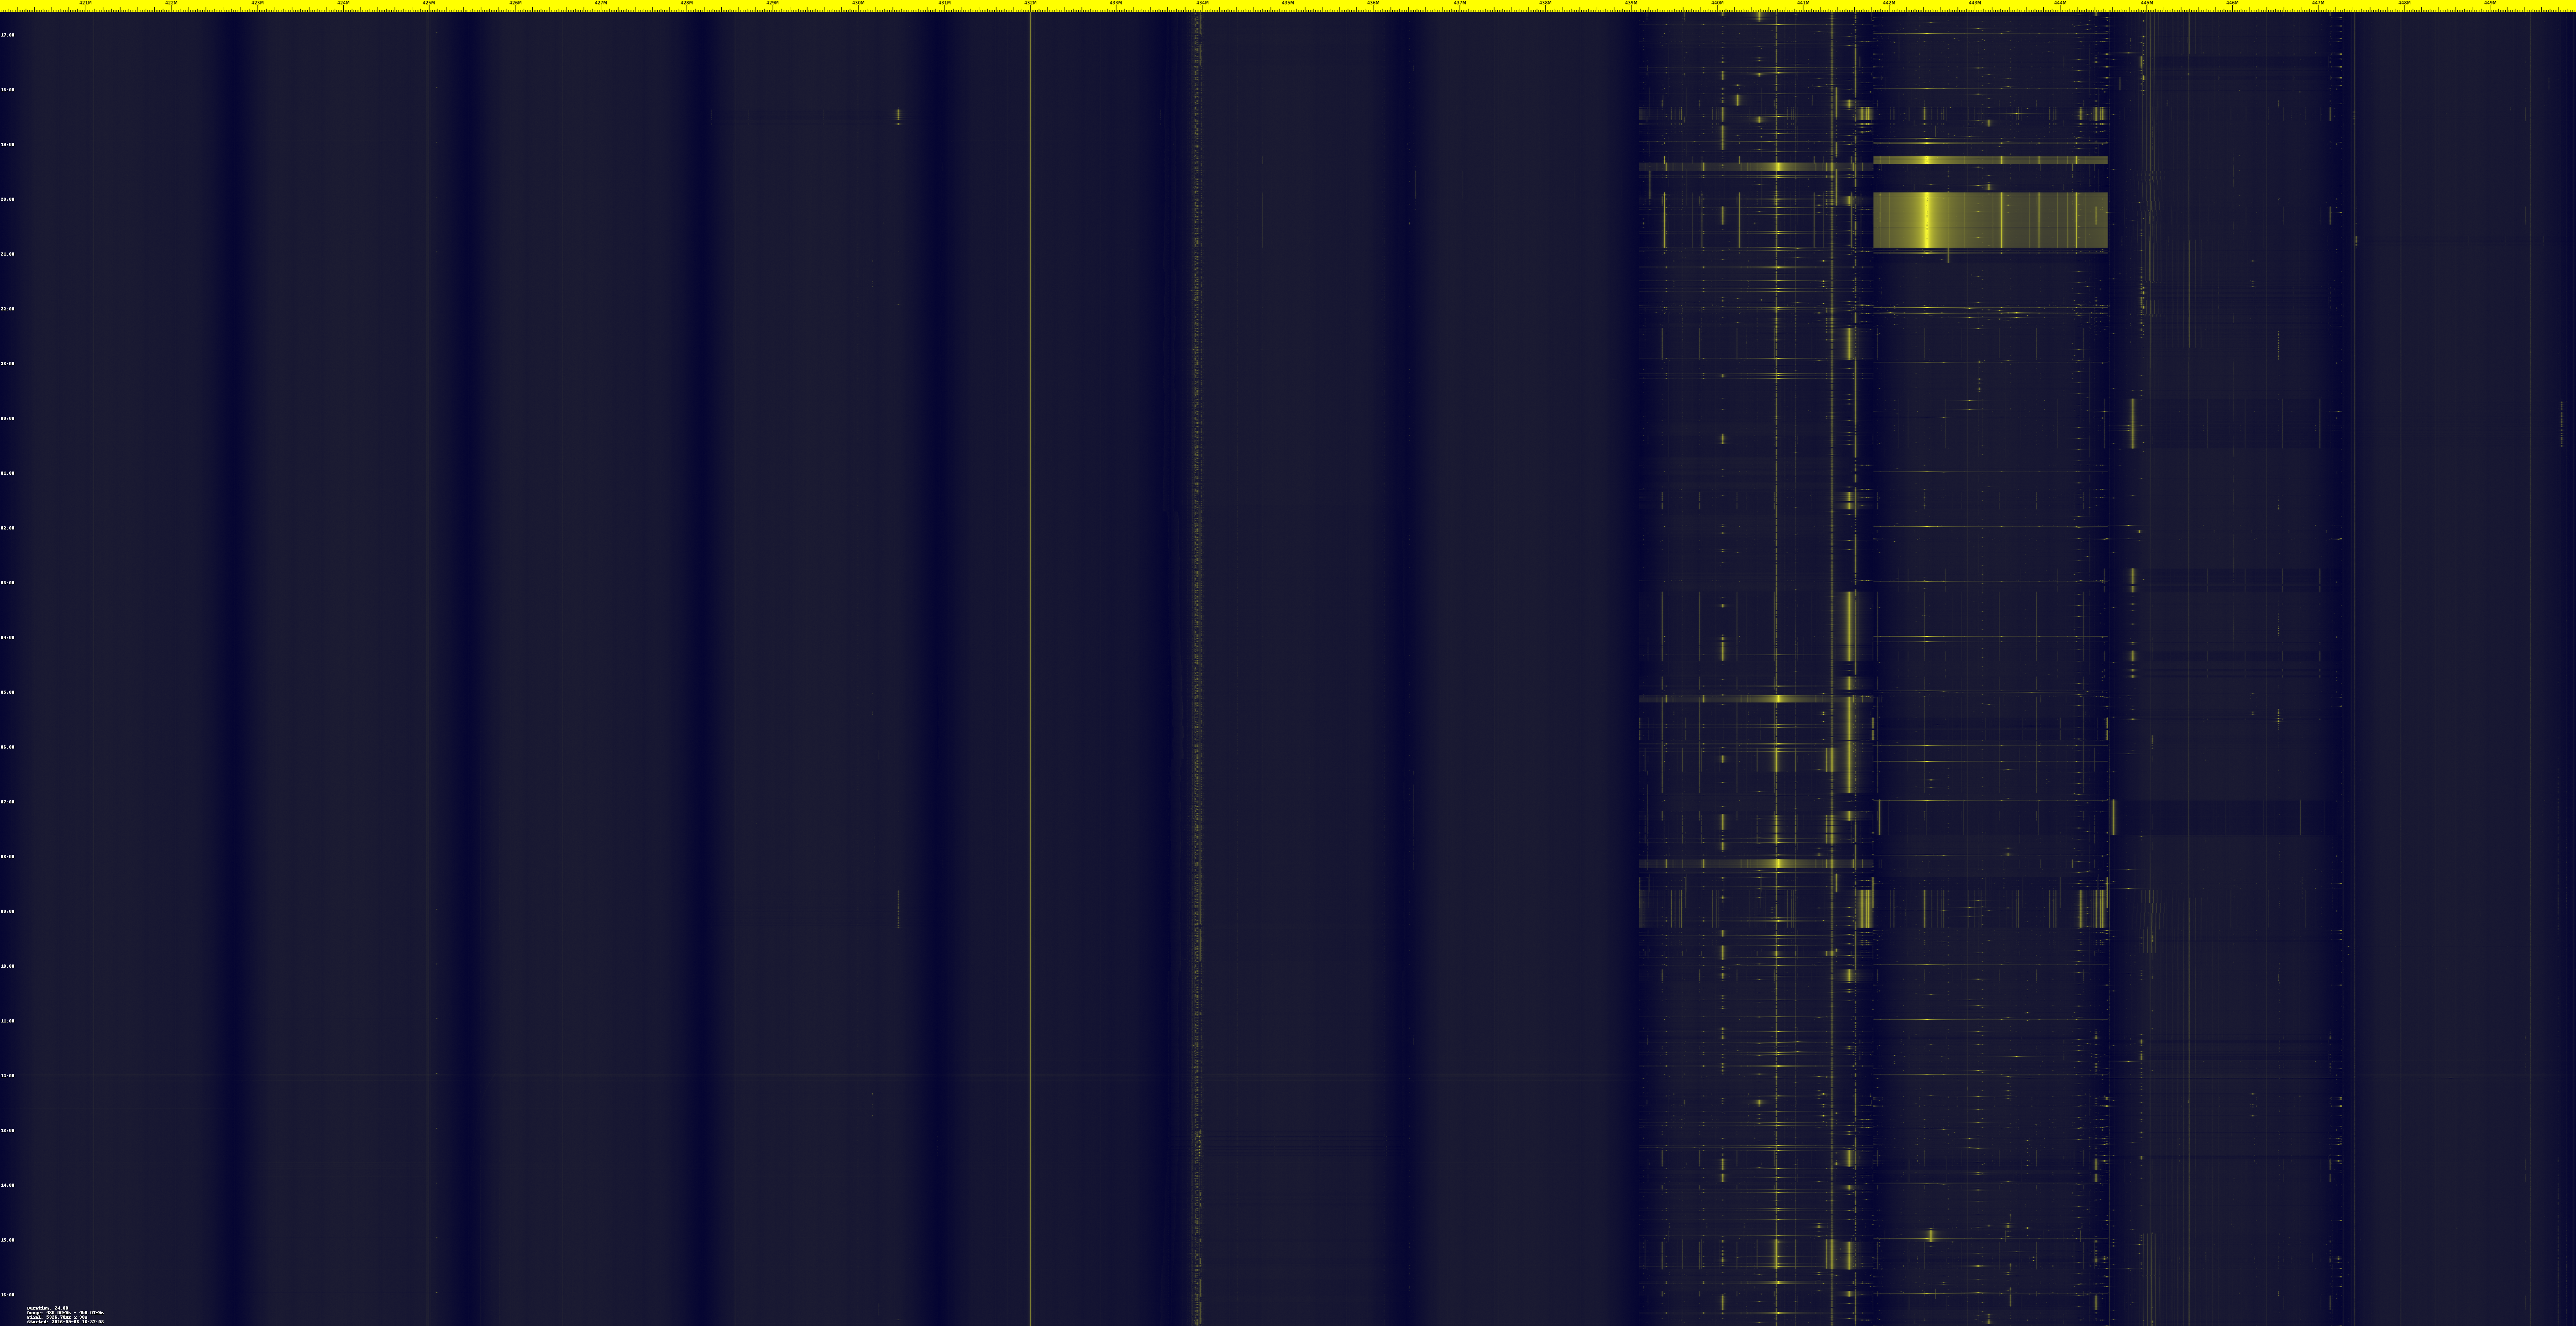